Open-source projects are spread across a wide spectrum of maturity and activity. When choosing to use open-source it’s important to select a project that has lots of active contributors and recent development unless you’re expecting to take on the project development yourself.
Determining project activity can be done by looking at project statistics such as GitHub provides. Often projects are started by a single individual who has a particular problem they want/need to solve. Once the software is “working” the project can stagnate. A few select projects reach a critical mass where multiple contributors work to keep the project up to date, fix bugs, add features and create a large useful popular project.
Open-source activity basics
Here we will compare a small semi-active project Netflix curator with an active popular one, Angular.js to see how you can tell the difference. First, there are three basic statistics at the top of every GitHub project: Watch, Star and Fork.
![]()
![]()
Watch is the number of people who have added the project to their watchlist. This gives them updates about the project and is an indication of the number of people who care about changes to the code, rather than just use the project.
Star is the number of people who find a project interesting and want to indicate that. It also adds a bookmark for favorite projects.
Fork is the number of people who have cloned the repository with the intention of adding their own changes to it. Often times such people don’t actually contribute but it shows a level of interest in contributing.
Notice that the very popular and active Angular.js project has over ten times as many watchers as Netflix curator. As for Forks, Angular.js has an even bigger margin over Netflix curator – almost one thousand times as many forks.
Contributors
A second area to look is the “Graphs” tab which shows graphically information about contributors, frequency of code changes, etc. The graphs below show the contributors to each project.
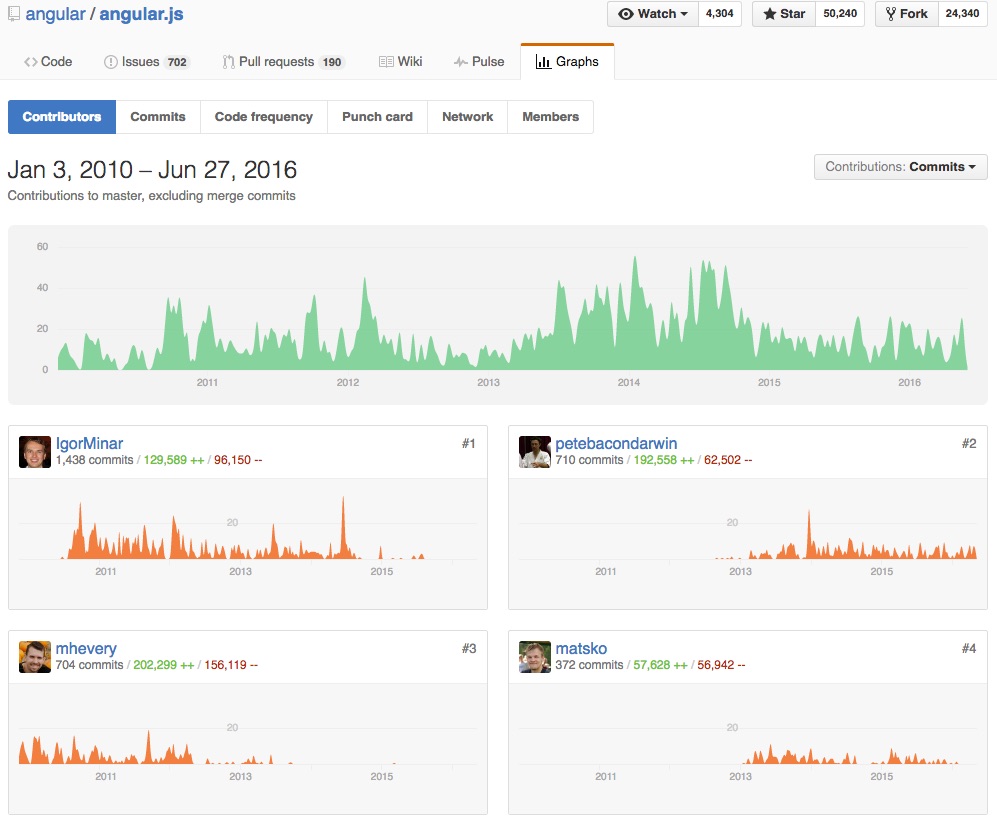
Angular.js top contributors
Notice that the top 4 contributors to Angular.js each have tens of thousands of commits. The list of significant contributors is quite large which not only provides a wealth of ideas for new features but also reduces risk when a contributor leaves the project.
In contrast, the top 4 contributors to Netflix curator quickly drops to less than 100 commits – again a difference of almost one thousand times. If the main contributor leaves, or grows bored and moves on to something else, the project is completely stagnant – if you want anything you’ll need to do it yourself.
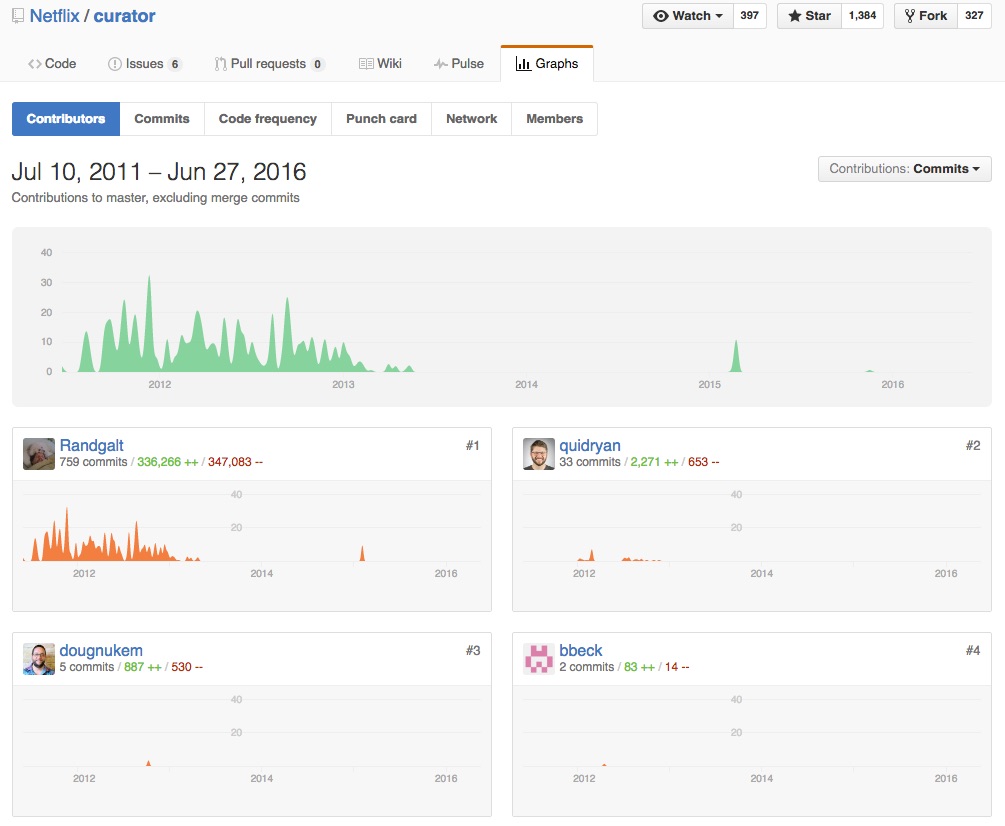
Netflix curator top contributors
Code change frequency
Next we can look at the frequency of code change. The Netflix curator exhibits a common tendency for a project to stagnate at some point as it has the basics of the desired functionality from the single original contributor.
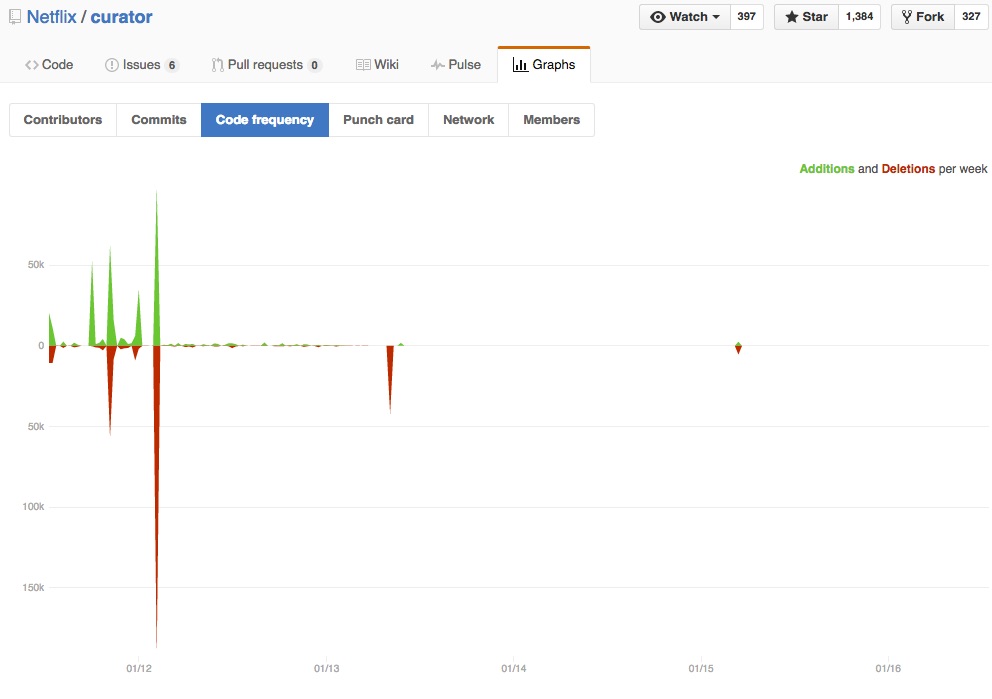
Netflix curator code update frequency
A larger set of contributors with more ideas and free time helps to keep a project vibrant as you can see with the Angular.js project. Studies have shown that larger and more complex open-source projects tend to attract more developers.
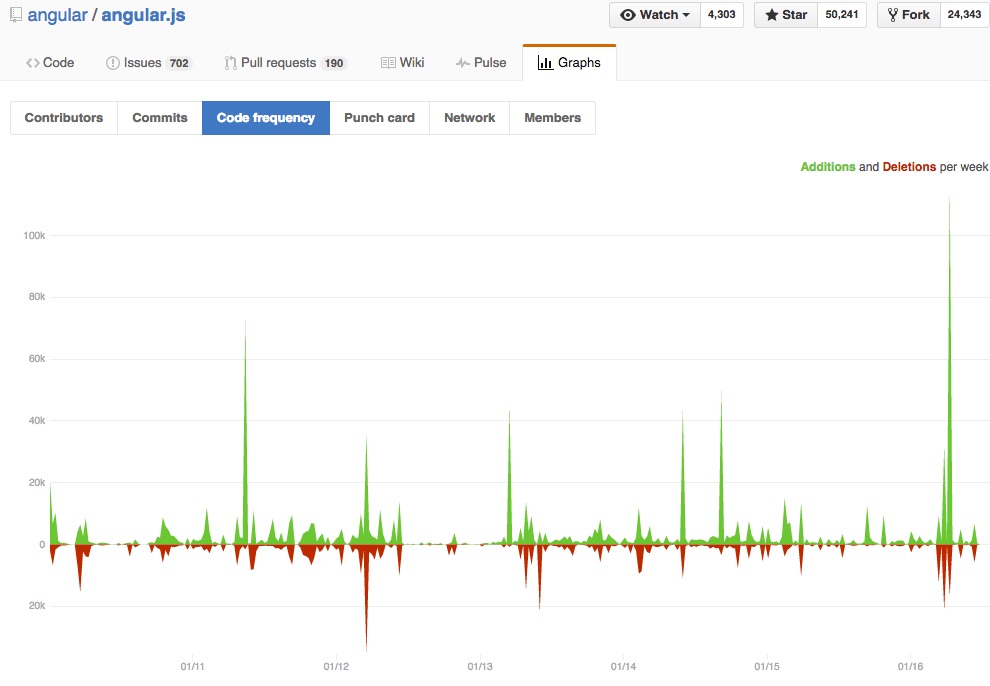
Angular.js code update frequency
Network / Project forks
Finally, we can check the network graphs to see how many people are forking the project and doing something new with it, which is a telling indicator of how many people are really interested in the project and want to do their own thing with it. Note here that we have only a couple of forks for Netflix curator that were never merged back in,
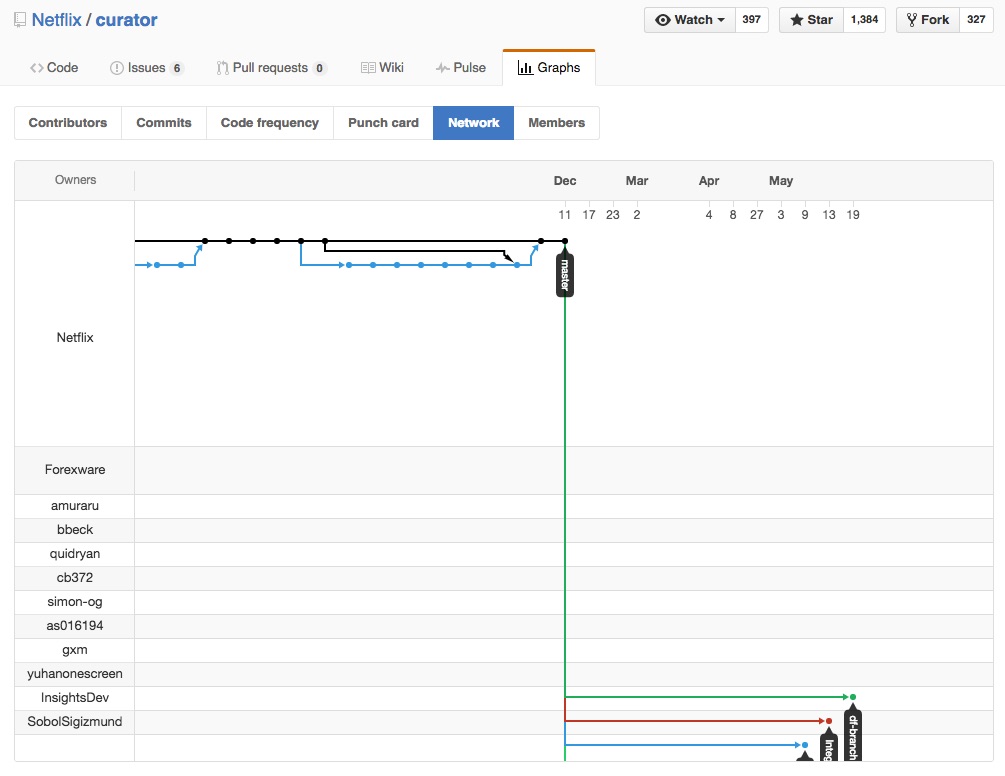
Netflix curator network forks
while the Angular.js project has too many forks to display.
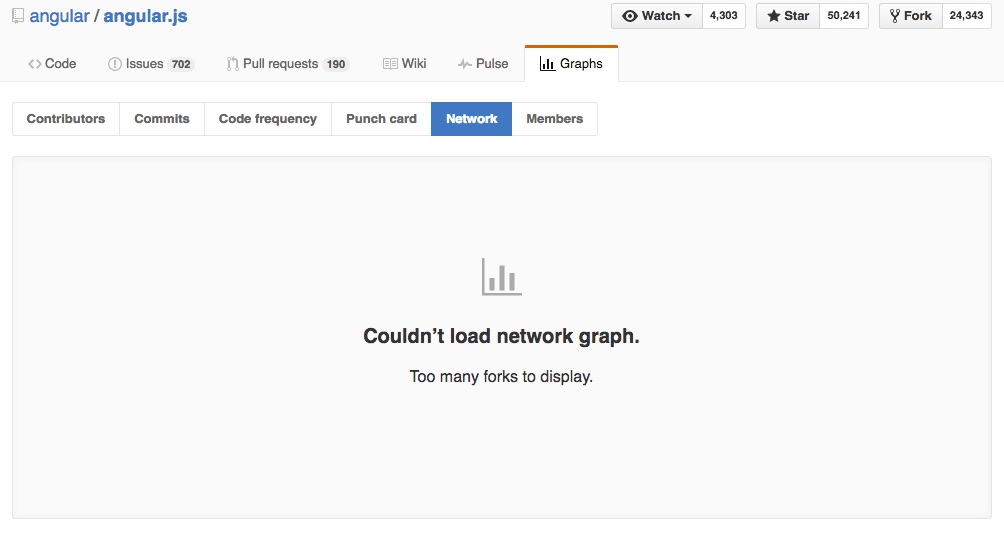
angular.js network forks
At any given time you can quickly see which repositories are most active by checking https://bithub-ranking.com and an explanation of the GitHub statistical graphs are available at https://help.github.com/articles/about-repository-graphs/.
While most typical open-source projects won’t make the most-popular list, doing a bit of investigation into the health of an open-source project can help make sure that the code you’re using will be maintained and updated to keep up with emerging technologies for years to come.
